

VSA Analytics
Key Highlights
- VSA Analytics is a robust, interactive, and user-friendly tool to support college and university leaders’ use of data in strategic planning and decision making.
- VSA Analytics allows users to build custom visualizations and graphical reports in just minutes and eliminates the need for institutions to spend days searching, downloading, integrating, and analyzing data.
- Designed to bring flexibility to campus users, VSA Analytics offers more than 25 benchmarking reports based on a custom dataset that contains more than 350 variables from about 4,200 institutions.
VSA Analytics is a robust, interactive, and user-friendly platform for colleges and universities to compare and analyze key performance metrics across institutions. VSA Analytics allows users to build custom analytical and graphical reports with a custom platform in just minutes and eliminates the need to spend days searching, downloading, integrating, and analyzing data. Subscribers can add as many campus users as they would like and download the entire custom dataset. The VSA is supported by APLU and the American Association of State Colleges and Universities (AASCU).
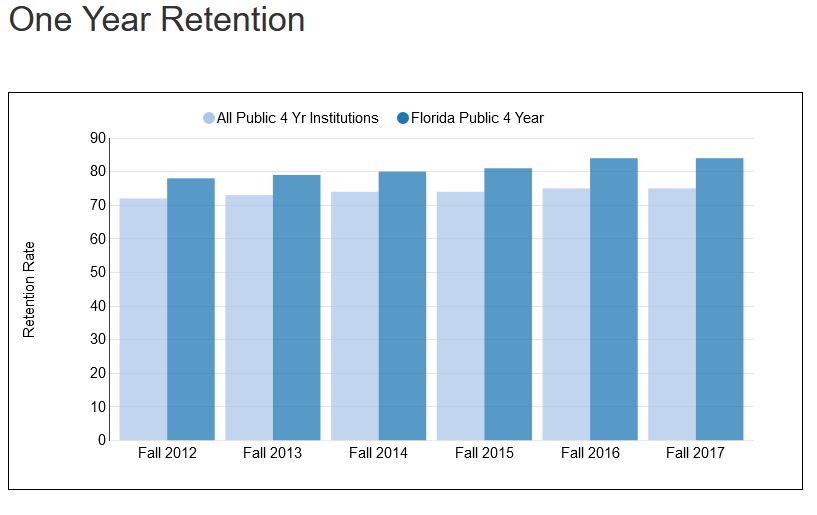
Each interactive report offers a national profile of a population of institutions defined by the subscriber. In addition, users may benchmark their institution against a custom comparison group and all reports can be downloaded and printed. VSA Analytics offers trend reports with 9 years of integrated national data and new data sources will be added in 2019.
For more information on the VSA Analytics program and participation guidelines, visit the VSA Analytics website at www.VsaAnalytics.org.
You may also contact executivedirector@vsaanalytics.org.
Featured Project & Initiative

Stay Connected
X (formerly Twitter)
Facebook
YouTube
LinkedIn
RSS